Overview
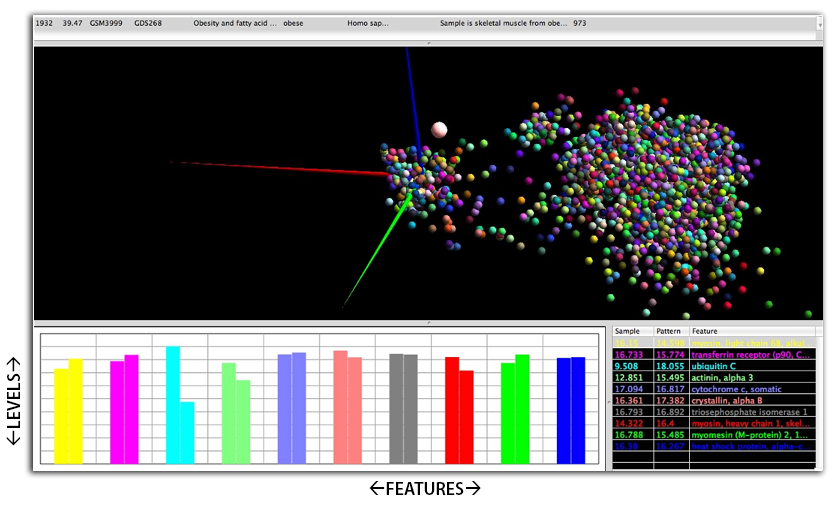
GeneBrain® is a software tool that models large volumes of complex data for monitoring, classification of samples, repository querying, biomarker identification and the refinement and validation of hypotheses. GeneBrain® sits atop your data pipeline, integrating data from multiple platforms. We developed it to make data analysis simple, intuitive, and visually appealing.
GeneBrain® has been successfully applied to:
- Clinical studies, including vaccine efficacy,
- Research data such as gene expression and proteomics,
- Biosurveillance, and
- The integration of data from multiple technology platforms.
GeneBrain® enhances this work through:
- The ability to visualize data—enabling detection of outliers or lack of uniformity in enrolled patient populations
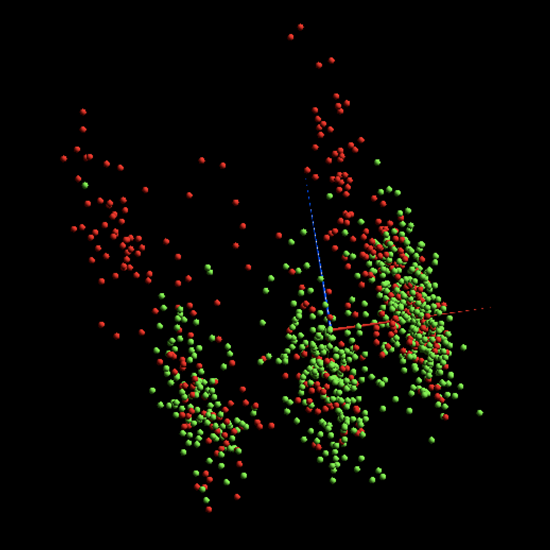
- Identification of which data features or groupings of features out of thousands are predictive or characteristic
- Integration of multiple data pipelines for effective, unified analysis
- Query capability to find matching patterns whether actual or hypothetical
- The ability to formulate and refine hypotheses about data in silico saving research costs
- Putting data exploration into the hands of non-mathematicians to explore high dimensional data and full repositories for discovery, surveillance and hypothesis testing using visualization tools

Find similar patients within an entire repository; make comparisons of their relevant data features with a single click.
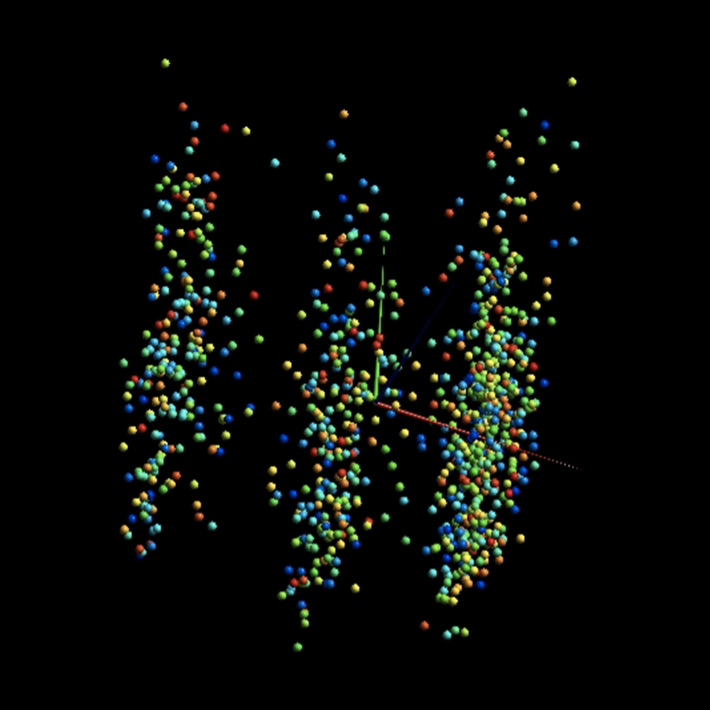
Obtain understanding of groupings and non-uniformity of SNP distribution in an enrolled patient population by visual inspection.